
Electromagnetic Waves and Spectrum
Electromagnetic spectrum and waves diagram or entire chart represent the number of radiation spectra (frequency, wavelength, and energy) formed by the electrical field and magnetic field in quantum physics or chemistry. Each type of electromagnetic emission spectrum such as radio waves, ultraviolet-visible (UV-vis), infrared (IR), and microwaves travel at the speed of light in a vacuum with a definite range of frequencies, wavelengths, and energy. Electromagnetic radiation or rays can describe the two characteristics, particle properties (mass and momentum) and wave properties (energy, frequency, and wavelength). The various portions of electromagnetic waves and spectrum in spectroscopy contain different names according to behavior and applications of spectra like emission, transmission, and absorption.
Electromagnetic Spectrum Diagram
The shortest and longest wavelength of the electromagnetic spectrum radiation diagram defines the distance between two consecutive series of lines. It can be expressed by units like meters, millimeters, micrometers, or nanometers.
In addition to the wavelength scale, the frequency scale is also used to derive electromagnetic radiation for learning chemistry and physics. The frequency of the spectrum is defined as the number of complete cycles per second (cps). It can also expressed by Hertz according to the name of German physicist H.R Hertz.
Wavelength Frequency and Energy
The definition of wavelength and frequency in the electromagnetic spectrum suggests that the wavelength is inversely proportional to frequency.
However, de Broglie’s relation provides a common equation between the frequency, wavelength, and electromagnetic energy in spectroscopy.
Energy (E) = hν = hc/λ
where h = Planck constant = 6.62607004 × 10⁻³⁴ m2 kg/s
According to the de Broglie facts, when the frequency of the bands is very high or the wavelength of the bands is very short, the electromagnetic energy of the emission spectrum is also very high. For example, X-rays are more energetic than visible light in science.
Electromagnetic Spectrum Chart
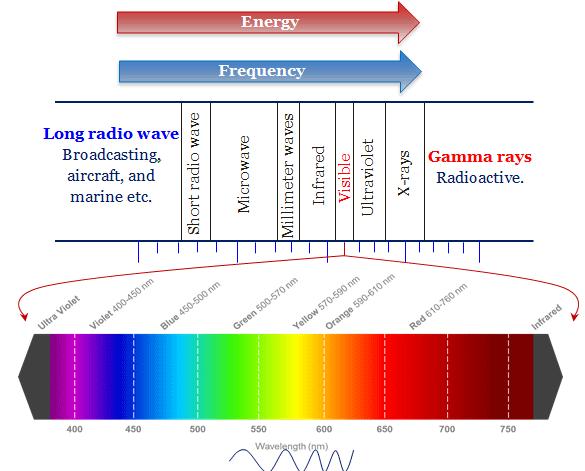
The classification chart of the electromagnetic radiation flows from cosmic rays to the microwave regions. However, the visible spectrum flows from the wavelength of 400 nm to 750 nm or violet to red color.
The below table includes different types of electromagnetic regions with frequency and wavelength of emission or absorption spectra.
| Electromagnetic spectrum region | Wavelength (λ) | Frequency (cm-1) | Energy (kJ/mole) |
| Cosmic rays | 5 × 10⁻⁵ nm | ||
| Gamma rays | 10−3 – 15 nm | ||
| x-rays | 0.01 – 15 nm | ||
| Far UV | 15 – 200 nm | 666,667 – 50,000 | 7979.8 – 598.3 |
| Near UV | 200 – 400 nm | 50,000 – 20,000 | 598.3 – 299.2 |
| Visible | 400 – 800 nm | 25,000 – 12,500 | 299.2 – 149.4 |
| Near IR | 0.8 – 2.5 μ | 15,500 – 4000 | 149.4 – 47.7 |
| Vibrational IR | 2.5 – 25 μ | 4,000 – 400 | 47.7 – 4.8 |
| Far IR | 0.025 – 0.5 mm | 400 – 200 | 4.8 – 2.4 |
| Microwave | 0.05 – 300 mm | 200 – 0.033 | 2.4 – 2.2 × 10⁻⁴ |
| Radio frequencies | 0.3 -109 m |
Different types of the spectrum on the above wavelength or frequency chart show that the visible region of spectra contains very small parts of the entire electromagnetic rays. Therefore, the waves of the visible region are slightly higher than IR radiation and slightly lower than the ultraviolet spectrum.
Electromagnetic Spectrum Region
Gamma-Ray Region
The Gamma-ray region on the electromagnetic spectrum lies between 10−3 to 0.14 nm. The gamma rays are the shortest waves emitted by atomic nuclei involving energy changes from 109 to 1011 Joules/gram atom.
X-Ray Region
The X-ray region lies between 0.01 to 15 nm. Therefore, x-rays are emitted or absorbed by the movement of electrons close to the nuclei of heavy atoms. It involves energy changes close to ten thousand kilojoules.
Ultraviolet-Visible (uv-vis) Region
The UV-visible light brings the electron from lower atomic energy levels to higher energy to form the atomic spectrum with a definite frequency and wavelength. The visible regions of the electromagnetic spectrum lie mostly between 400 to 750 nm wavelengths.
Within the visible region, a person with normal colour vision can correlate the wavelength of light striking the eye with the subjective sensation of colour. The colour of the light with approximate ranges of wavelength are given below the table,
| Colour of light | Wavelength |
| Violet | 400 – 435 |
| Blue | 435 – 480 |
| Green-blue | 480 – 490 |
| Blue-green | 490 – 500 |
| Green | 500 – 560 |
| Yellow-green | 560 – 580 |
| Yellow | 580 – 595 |
| Orange | 595 – 610 |
| Red | 610 – 750 |
Infrared (ir) Region
Near-infrared, vibrational infrared and far-infrared are the three sub-regions of the IR spectrum. In Infrared (ir) spectroscopy, the vibrational movements of the molecules change to form vibrational excitation among the molecules. Therefore, it is one of the most valuable regions of the electromagnetic spectrum for the chemist.
Microwave Frequency Range
The microwave region in the electromagnetic spectrum lies between 0.5 to 300 mm. Microwave spectroscopy generally changes the rotational movement of the chemical bond in the molecule.
It deals with the pure rotational motion of molecules. Therefore, it is also called a rotational electromagnetic spectrum.
Radio Waves Frequency Range
The frequency of radio waves lies between 0.3 to 109 m. The energy changes involved in radiofrequency regions arise due to the spin of the nucleus or electron.
Electromagnetic Spectrum Uses
The energy and wavelength of spectrum radiation are different for different substances (atoms or molecules). When the electromagnetic energy of the system does not match, then the light is not absorbed by the substances or atoms.
Electromagnetic radiation in science uses widely to explain the most important physical or chemical properties and structure of inorganic and organic compounds or chemical elements present in the periodic table.
The electromagnetic model in spectroscopy is widely used in the field of science (chemistry, physics, biology, medicine, environmental analysis) in everyday life.


