Hydrogen Spectrum in Chemistry
Hydrogen spectrum (absorption or emission) is an important type of tool for the determination of the atomic structure of chemical elements or atoms in quantum chemistry or physics. Bohr Model explained the existence of various electromagnetic spectrum lines in the hydrogen atom for the spectroscopic study.
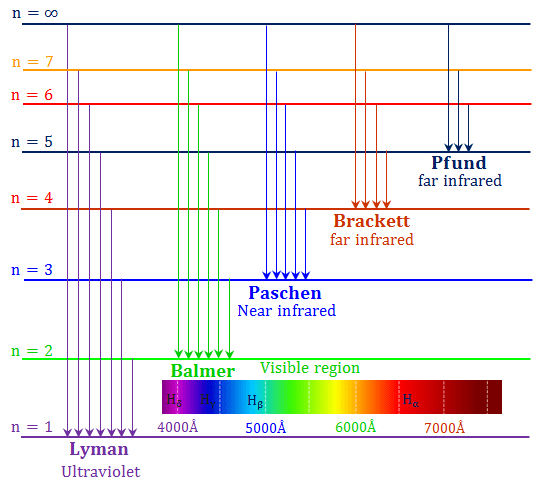
The calculation of the atomic emission or absorption spectrum is feasible in quantum chemistry or physics because each hydrogen energy level has definite energies in which the electron particle can stay. When the value of the principal quantum number increases the energy values for orbits become closer to each other.
The absorption energy corresponding to the electronic transition spectrum from n = ∞ to n = 1 gives the ionization energy of the hydrogen atom.
Hydrogen Spectrum Diagram
- On the addition of thermal energy or electrical energy, the electron moves to the higher energy level or higher energy orbital of an atom.
- When this excited electron returns to the ground state it forms the following emission spectrum diagram for the hydrogen atom with a definite frequency of radiation.
Emission Spectrum of Hydrogen
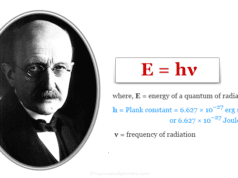
In 1901, Planck’s quantum theory proposed a formula for the electromagnetic radiation. He connected photon energy and frequency of the emitted light for the chemical elements in the periodic table.
According to Planck,
ΔE = hν
or, ν = ΔE/h
where ν = frequency of emitted light
h = plank constant
The energy corresponding to a particular line in the emission and absorption spectra or spectrum of hydrogen is the energy difference between the ground level and the exited level.
Bohr model provides the energy of an electron at a particular energy level. The energy of an electron,
En = −2π2me4/n2h2
ΔE = E2 − E1
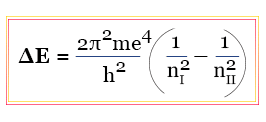 But the frequency of emitted light from the electromagnetic spectrum is related to energy by the plank equation,
ν = ΔE/h
With the help of this formula, we can calculate the frequency, wavelength, and wavenumber of the line observed in the hydrogen spectrum.
Rydberg Constant for Hydrogen
The spectrum equation of hydrogen is used to measure the values of the Rydberg constant for hydrogen in learning chemistry or quantum physics.
Rydberg constant (R) = 2π2me4/h3
= 3.2898 × 10¹⁵ cycles sec−1
We know that, ν = c/λ
or, ν = c × wavenumber
where wavenumber = ν/c
c = velocity of light in vacuum
The frequency (ν) in the spectrum indicates the number of waves passing a given point per second and is expressed as cycles per second in chemistry or physics.
Wavenumber in hydrogen spectrum data is defined as the number of waves connected in CGS or SI unit length that is per centimeter (cm−1) or per meter (m−1).
The experimental value of the Rydberg constant for the hydrogen spectrum is equal to 109737 cm−1 or 10973700 m−1. It slightly varies from atom to atom depending upon the nuclear mass.
Absorption and Emission Spectra
Putting n = 1, n = 2, n = 3, etc in the Rydberg equation we get the energies of the different stationary states for the hydrogen electron. The absorption or emission energy calculated from the Rydberg equation defines several series of lines in the electronic transition for the emission or absorption spectrum.
Spectral Lines of Hydrogen
- Hydrogen is given several spectral lines because any given sample of hydrogen contains an almost infinite number of atoms.
- Under normal conditions, the electron of each hydrogen atom remains in the ground state near the nucleus, which is n = 1 (K – Shell).
- When a specific heat or electrical energy is supplied to hydrogen gas, it absorbs different amounts of energy to give absorption spectra of hydrogen.
- Some of the atoms absorb such energy to shift their electron to the third energy level, while some others may absorb a large amount of energy to shift their electron to the fourth, fifth, sixth, and seventh energy levels to give different types of hydrogen absorption spectrum diagram.
- The electrons of hydrogen in the excited state are relatively unstable and hence drop back to the ground state by the emission of energy in the form of the spectrum.
- The different dropbacks mean different lines of the hydrogen spectrum.
Hydrogen Spectrum Series
According to the name of the discoverer, the transition from the ground state to the excited state constitutes the following spectrum series for the hydrogen atom,
- Lyman series
- Balmer series
- Paschen series
- Brackett series
- Pfund series
- Hampe series
The emission spectrum lies from the ultraviolet region to the far IR region obtained by putting the values of n1 and n2 in the Rydberg equation.
The longest or shortest wavelength or frequency of different spectral lines is represented in the below table,
| Series of lines | n1 | n2 | Spectral region | Wavelength |
| Lyman Series | 1 | 1 | UV | 4000 |
| Balmer Series | 2 | 2 | Visible | 4000 to 7000 |
| Paschen Series | 3 | 3 | Near IR | 7000 |
| Brackett Series | 4 | 4 | Far IR | 7000 |
| Pfund Series | 5 | 5 | Far IR | 7000 |
The explanation of the emission and absorption spectrum data for one electronic system like hydrogen atom or helium (He+) and lithium-ion (Li+2) by Bohr theory or model has some limitations.

